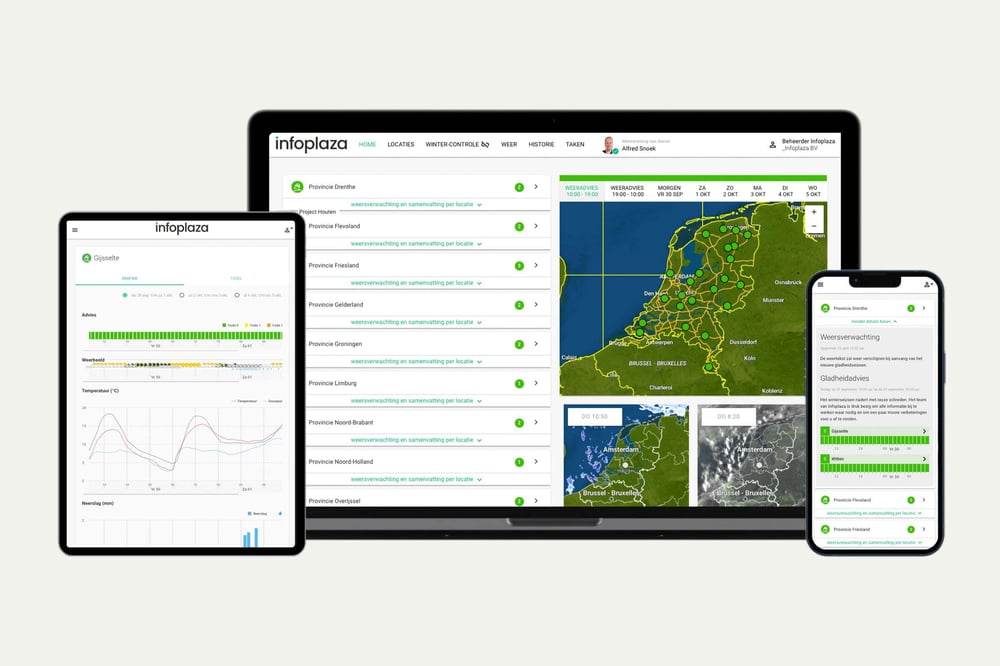




Dataplatform

All weather data. One platform. Ready for AI.

From weather forecasts, radar, and lightning to maritime data and road ice conditions: all the weather data you need, in one place. Connect your AI agents, applications, and tools via API and MCP, and turn weather data into actionable insights to inform your decisions.

Illustrative example
Infoplaza Dataplatform

Weather, sea, and public transportation

On the Dataplatform, you'll find not only weather data but also marine and mobility data. Combine them to see not only what the weather is doing, but also what it means for your operations.

Worldwide

Weather

From the next five minutes to the next fifteen days. Forecasts, radar, warnings, observations, and all major weather models.

  • Forecast
  • Radar Nowcast
  • Weather Alerts
  • Map Layers
Worldwide

Navy

Waves, swell, currents, and wind at sea—for a specific location or along your route. Plus data on 3,700 ports worldwide.

  • Route Forecast
  • Point Forecast
  • Marine Ensembles
  • Port Information
The Netherlands

Mobility

How people and goods travel by land. Real-time traffic on Dutch roads and live public transit information and departure times.

  • Live Traffic
  • Trip Planner
  • Departure Times
Weather Models

Explore all available weather models

Get access to a wide range of weather models: from global deterministic models to high-resolution regional forecasts.

  • ECMWF HRES Global Deterministic
  • DWD ICON Deterministic
  • Pangu-Weather Deterministic
  • DWD ICON-EU Deterministic
  • DWD ICON-D2 Deterministic
  • NCEP GFS Deterministic
  • ECMWF AIFS Deterministic
  • KNMI Harmony Deterministic
  • GraphCast Deterministic
  • ECMWF ENS Ensemble
  • DWD ICON-EPS Ensemble
Data layers

All data layers. One clear insight.

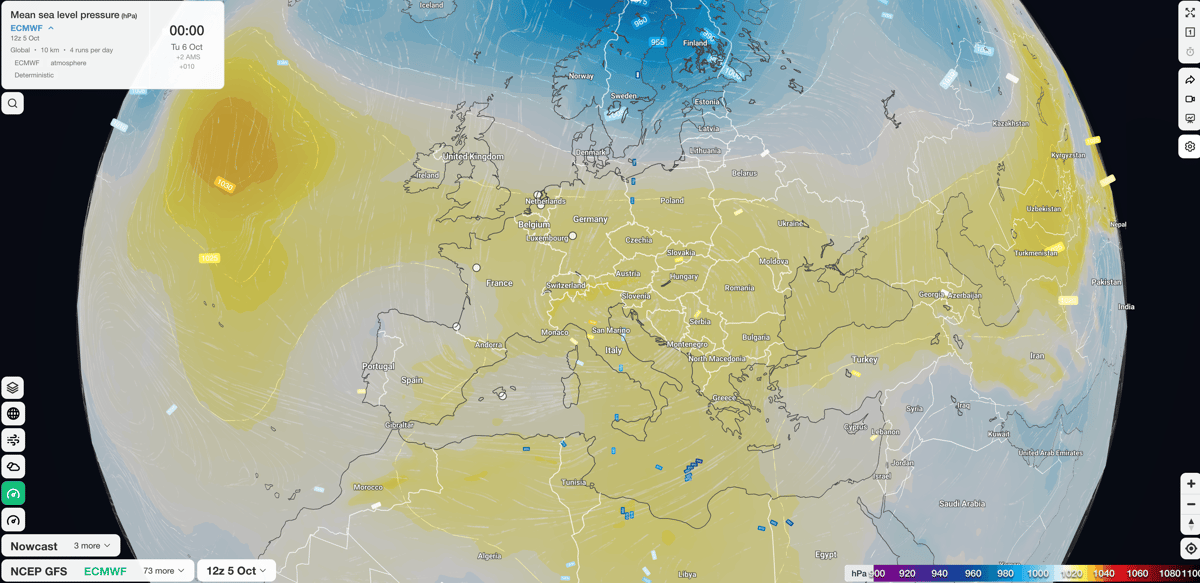
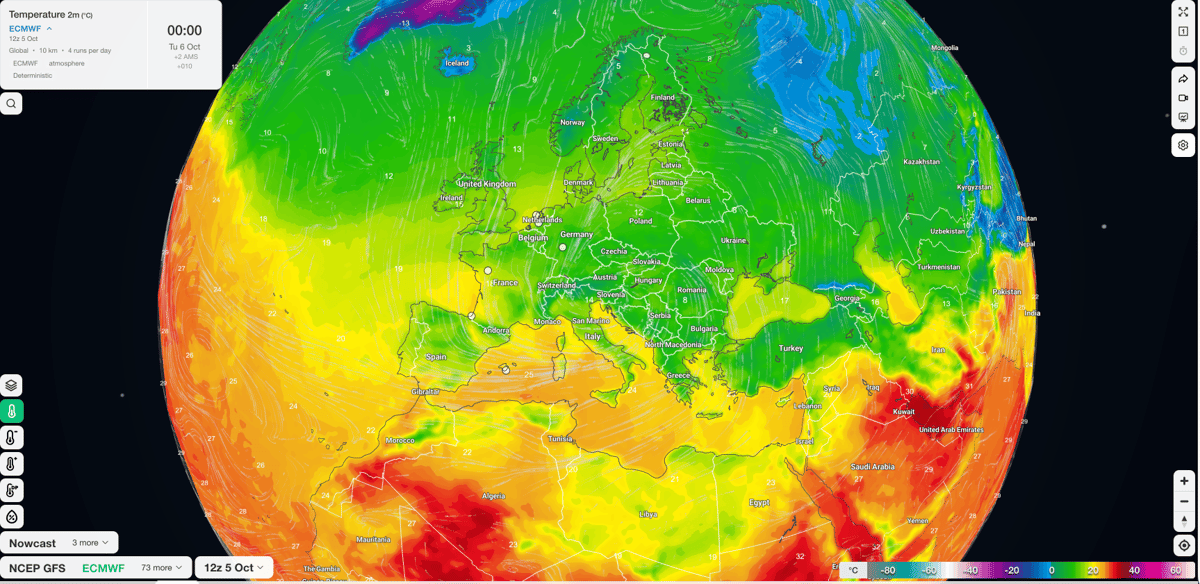
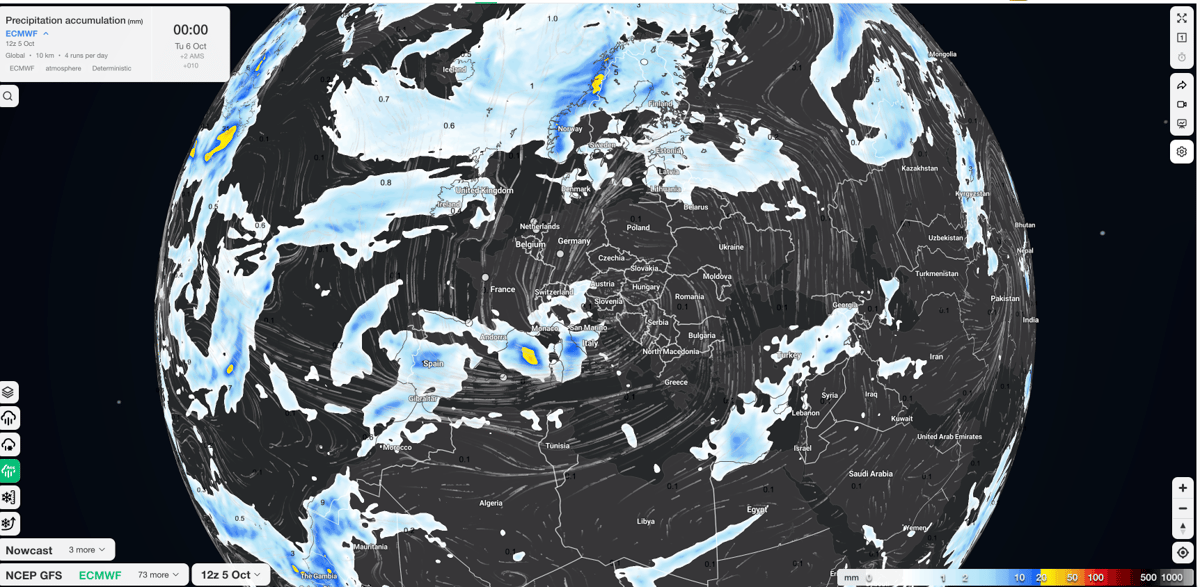
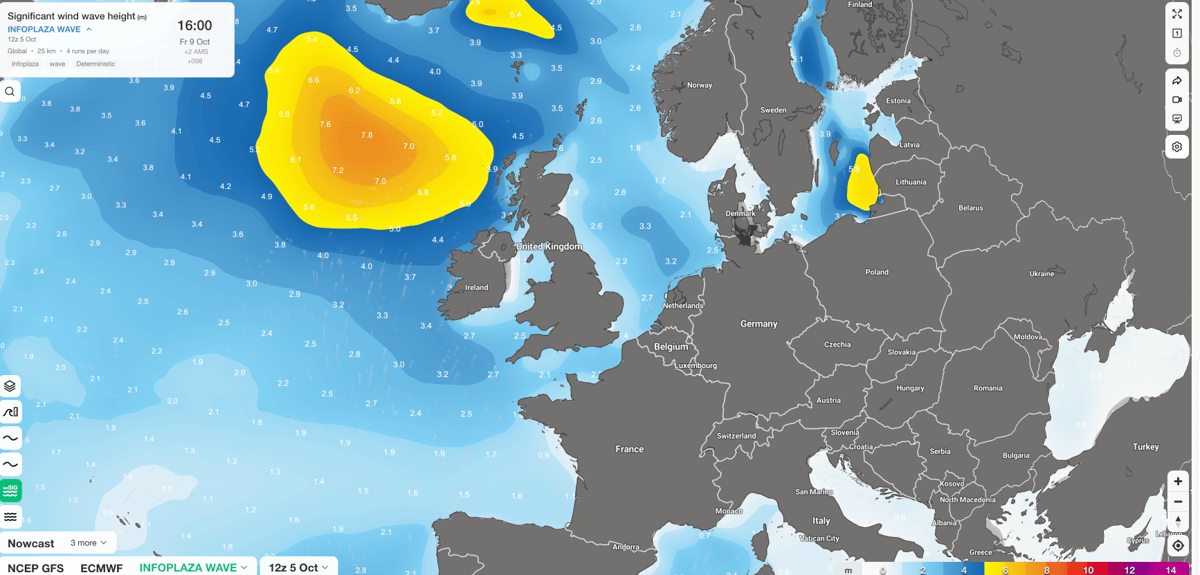
Combine air pressure, temperature, precipitation, and waves for your locations and see at a glance what to expect.

All the weather data you need

From cloud cover and visibility to pollen, radiation, and UV: clearly organized by category.

  • Basic Information The most commonly used weather data for integrations.
  • Air Quality and Aerosols Air Quality Index, gases, and particulate matter.
  • Cloud Cover and Visibility Cloud cover, cloud base, and visibility.
  • Convection and Thunderstorms Indicators of atmospheric instability and thunderstorms.
  • Pollen Concentrations by pollen type.
  • Precipitation Rain, snow, and chance of precipitation.
  • Air Pressure and the Atmosphere Air pressure, geopotential, and water vapor.
  • Radiation and UV Solar radiation and UV radiation.
  • Temperature and Humidity Temperature, humidity, and thermodynamic parameters.
Why choose the Infoplaza Dataplatform?

From weather data to application. Faster than ever.

Whether you’re building a travel app, optimizing logistics processes, or forecasting tomorrow’s weather, the Infoplaza Dataplatform provides the building blocks to get started quickly.

icon-authenticatie
Centralized authentication and documentation for all APIs
icon-dataformaten
Consistent data formats and tools that help developers move forward
icon-oplossingen
Ready-to-use solutions for faster integration into your application
icon-infrastructuur
Reliable infrastructure that scales with you, using data from trusted sources

Flag_of_Europe.svgA European approach

Whenever possible, we opt for European infrastructure. This ensures your data stays close to home, and our reliable, locally focused solutions align with European standards.
API: Our Data, in Your Tools

Integrate our marine weather data directly into your own systems. Keep your workflows intact and add reliable weather data where needed.

Two Ways to Use Infoplaza Weather Data in Your Operations

Whether you want to maintain control over locations and thresholds yourself, or integrate our data directly into your own systems, we offer two solutions that align with how your organization operates.

MWD Landing Page 1

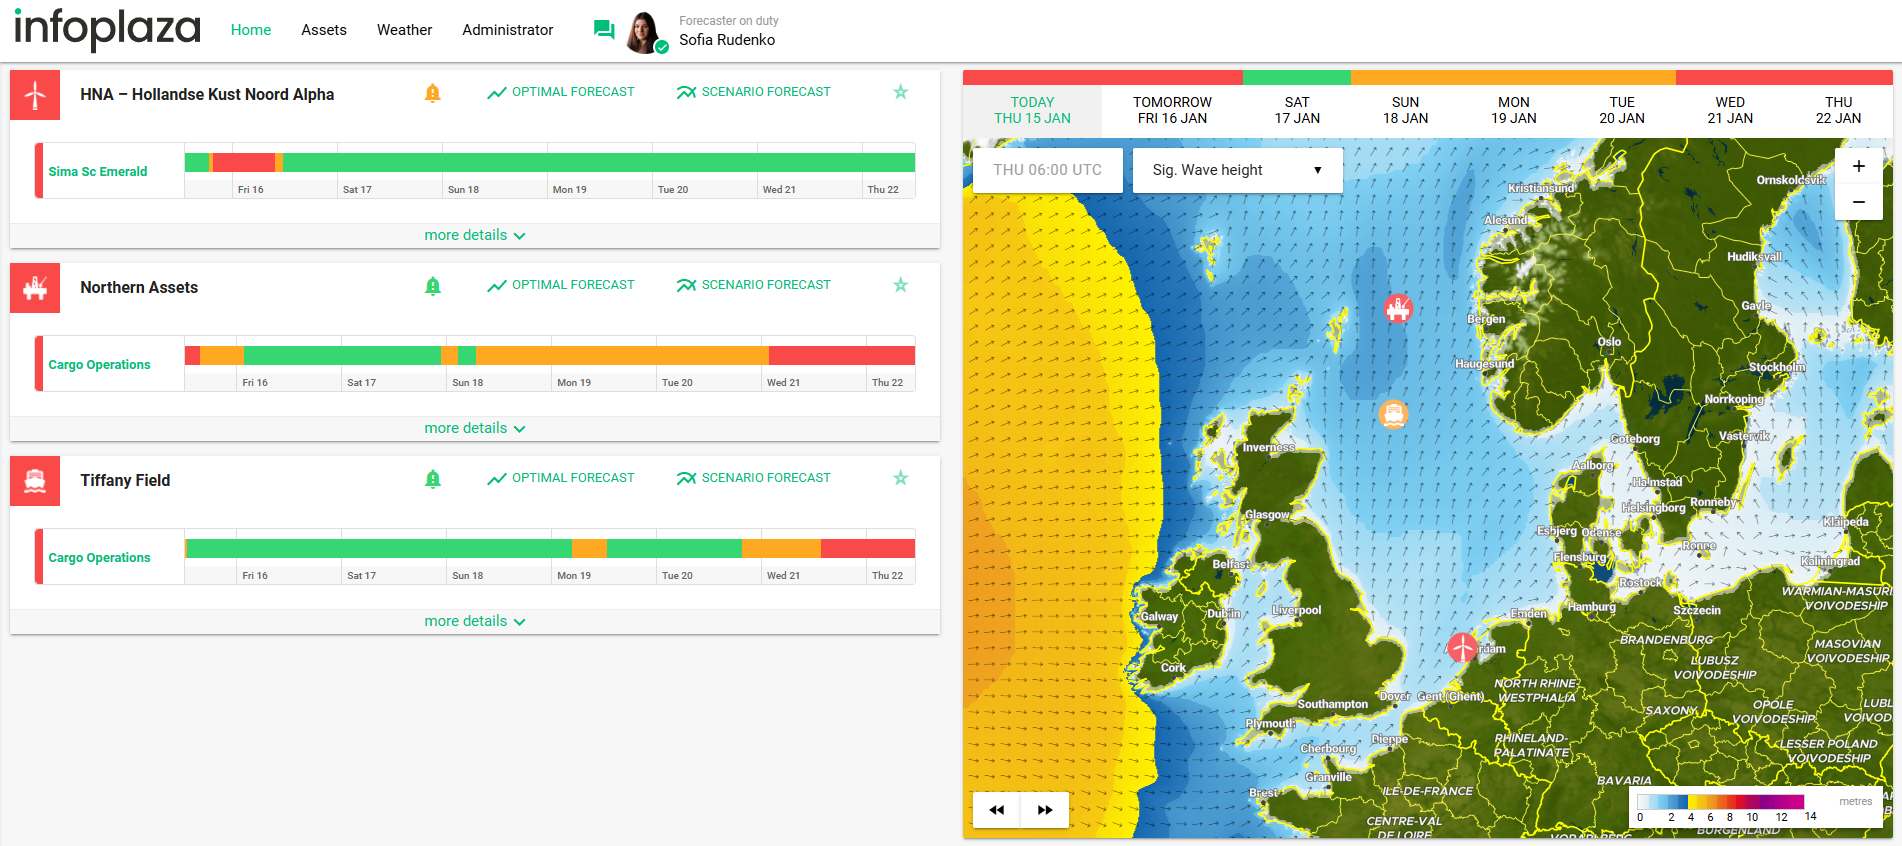
Dashboard: Instant Insight

Set your own locations and thresholds for your offshore operations. See at a glance whether conditions are safe for work.

Ideal for teams that:

  • Want to get started quickly, without technical integration
  • Want to manage thresholds themselves for each location

What you get:

  • Customizable locations and measurement points
  • Real-time alerts when thresholds are reached
  • Clear visualization of parameters
Screenshot August 13, 2026, 1:17:14 PM

API: Our Data, in Your Tools

Integrate our marine weather data directly into your own systems. Maintain your workflows and add reliable weather data where needed.

Ideal for teams that:

  • Want to combine weather data with other data sources
  • Build their own dashboards or automations

What you get:

  • Direct access to relevant data sources
  • Flexible integration with existing tools
  • Documentation and implementation support
Customer Stories

Our Customer Stories Featuring the Marine Weather Dashboard

spirit-chiswick
Spirit-Energy-White
"We make the most of the accurate weather forecast we receive every day"

Vincent van Bugnum, Logistics Focal Point at Spirit Energy Netherlands

Read more
waterfront-construction-groyne
Van Oord
Van Oord shares observation data from its wave buoys with Infoplaza, which is crucial for local weather forecasts. By collaborating with the weather service in this way, they receive the most accurate forecasts for their offshore operations, at every location.

Read more

DNV-compliant

Dutch Wind Energy Association

British energy network NOF

Other Solutions for Your Maritime Operations

In addition to the Marine Weather Dashboard, we offer more tools tailored to the day-to-day operations of offshore and nearshore teams:

  • Wave Climate:
    Statistical data for long-term planning of future operations


  • Ice Charting:
    Global ice forecasts

  • i-nav:
    Smart route optimization

FAQ

FAQ: Marine Weather Dashboard

You can get started right away. With just a few clicks, you can create a project and get an overview of the weather conditions at your location—without any technical integration or waiting time.
The demo is a free, full version of the dashboard where you can log in and try out the features based on your own locations and settings. There’s no sales pitch or obligation involved—you can explore it yourself, at your own pace, to see if the dashboard fits your operations.
Yes, in addition to offshore operations, we also offer high-resolution models specifically designed for nearshore locations, so you can get accurate forecasts even closer to the coast.
Yes, you set the limits yourself that are relevant to your operation. This gives you a feasibility window tailored to the specific safety and operational requirements of your project.
In addition to the dashboard, we also offer an API that allows you to integrate our weather data directly into your own tools and workflows. This way, you can keep your existing systems and add reliable weather data where needed.
Our forecasts are based on a multi-model mix, sometimes involving as many as 100 different scenarios, which allows us to present not only a forecast but also the associated uncertainty. Our meteorologists continuously calibrate the models using real-time observations.
Yes, you can easily grant colleagues and other stakeholders access to the dashboard. This way, everyone works with the same, objective weather data, and you avoid disputes over different sources of information.
Yes, our team of marine meteorologists monitors the weather around the clock and issues timely warnings when the weather poses a risk to your plans.

Try it free. No strings attached.

  • Forecast API
  • Nowcast API
  • All models & elements
  • 5,000 free credits per month

Need help?

Our team is happy to help you get the most out of our platform

Contact us