It doesn’t really matter where you conduct your maritime operations, waves will irrevocably play a crucial role in the overall success and progress you will be able to make offshore. Obviously, wave-induced motions can pose significant challenges, affecting equipment integrity, and the safety of personnel. As such, correctly understanding and interpreting wave forecasts is of high importance to the overall operability of our clients. In this article we will explain the difference between the two most commonly used labels to determine wave height.
Wave dynamics
Ocean waves are primarily generated by the transfer of energy from the wind to the water's surface. As the wind blows across the ocean, friction between the air and the water creates ripples that evolve into waves; circular motions which also develop over a certain depth whilst moving through the water. The size and strength of waves depends on various factors, including wind speed, duration, and fetch (the distance over which the wind impacts the water surface without interruption).In contrast to what is mostly believed, the water displacement within a wave is very limited. It is a circular motion through the medium instead of the medium moving around itself. In other words, a wave is a mechanism for kinetic energy to be transferred from one water molecule to another. Only in a rather shallow surface layer the water is actually being displaced horizontally while the total circulation of the wave stretches deeper into the water column. Obviously, when we increase wind speed the depth in which the water is being displaced horizontally increases as well.
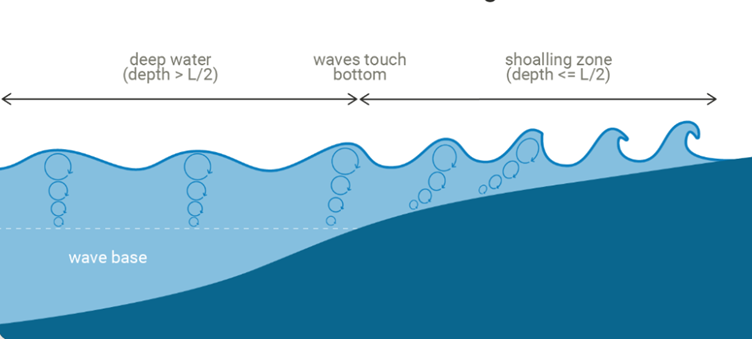 Fig 1. Waves entering the shallows. Note the quick decline in wave energy at greater depth.
As each wave system is linked to a certain atmospheric setting, the various weather systems scattered across the ocean each produce their own sets of waves through time, which tend to move around in groups while interacting with each other along the way. Only long-waved swells are eventually able to escape their spawning grounds and move around the ocean for thousands of miles. Dispersion and dissipation will ensure that eventually only one predominant wave system moves out from the parenting weather system at the same time. But, given the common presence of multiple weather systems, several associated wave systems can and will interact at certain locations, possibly creating quite chaotic wave fields at times.
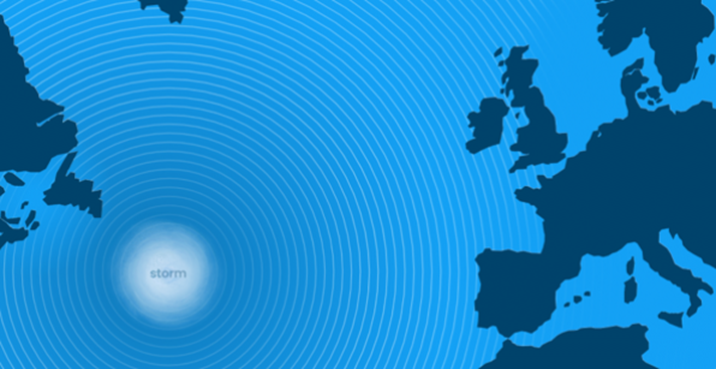 Fig 2: a storm produces rapidly outward-moving waves (swell) across the Atlantic.
Making sense of the chaos
To make sense of the chaos which the ocean sometimes is we need to introduce labels to quantify wave height, wave period and wave direction. For now, we will only focus on Significant wave height (Hs) and Maximum wave height (Hmax).Significant wave height (Hs)
In contrast to what is mostly believed Hs is not the average or mean wave height. This commonly used parameter actually resembles the average of the highest one-third (33%) of waves that occur in a given period. It is an important forecast parameter as higher waves are usually more significant than smaller waves. As Hs is an average of largest waves you should be aware that many individual waves will still probably exceed the value of Hs at that point in time (see figure 3).
 Fig 3. Place of Hs in a wave graph
On average 15% of waves will be equal or exceed the significant wave height. In some cases waves might exceed up to 30% of the given value of Hs. When looking at a classic Rayleigh distribution (fig. 4) statistically this would generally mean that with an Hs of 10m:
1/10 waves >10.7m,
1/100 waves > 15.1m
1/1000 waves > 18.6m Fig 4, Hs is placed well above the average wave, but still some waves will exceed this value
Maximum wave height (Hmax)
This parameter is less commonly used, but can be of great importance when planning or executing your maritime operations as it resembles the ceiling value of a particular period. Hmax is determined by ~1.86 times Hs and represents the one out of a thousand waves.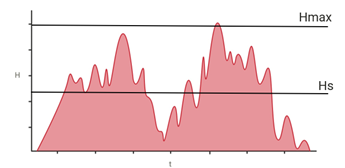 Fig 5. Hs and Hmax placed in a wave graph
Obviously, this does not include freak waves and tsunami waves. The latter are nothing like common waves. Normal ocean waves possess a clear undulating motion at the water surface as they move through the water. Tsunami waves on the other hand have a strong upward branch but then plateau instead of declining again after the wave has passed. The next wave tops the previous one and plateaus at an even higher level afterwards, etc. So, with every consecutive wave the water level rises. This is what enables the immense forces involved in passing Tsunami waves. They are actually walls of water and the true powerhouses in the world of waves. This will be a topic in a later article.