Forecast verification is a crucial process for ensuring the quality of marine weather forecasts. Accurate and adequate observations play a key role in making this process successful. Comparing our forecasts to observations enables us to fine-tune our services by selecting the right models and eliminating structural forecast errors. Additionally, we can provide our customers with insights into the quality of our forecasts through monthly verification reports. Through these efforts, we aim to bring more value in guiding you to the decision point.
At Infoplaza, we generate hundreds of forecasts every day. Our goal is to deliver the most accurate and precise forecasts to our customers, achieved by using the best combination of weather models, complemented by satellite and radar imagery, along with observations of several weather and sea state parameters. It is crucial for us to ensure that the services we provide align with the actual observed conditions, meeting the expectations of our customers.
Precision vs. accuracy
Weather models are continually improving, with advancements such as increased resolution and a more comprehensive description of various weather phenomena. However, it is important to note that weather models can never be perfect. For instance, enhancing model resolution may result in more precise output, but it doesn't necessarily guarantee greater accuracy. Precision reflects how closely successive forecasts align with each other, while accuracy determines the proximity of the forecast to the correct value. A forecast with high precision may not always be accurate (see Figure 1). Therefore, it is crucial to assess the accuracy of our forecasts, a process known to meteorologists as 'forecast verification'.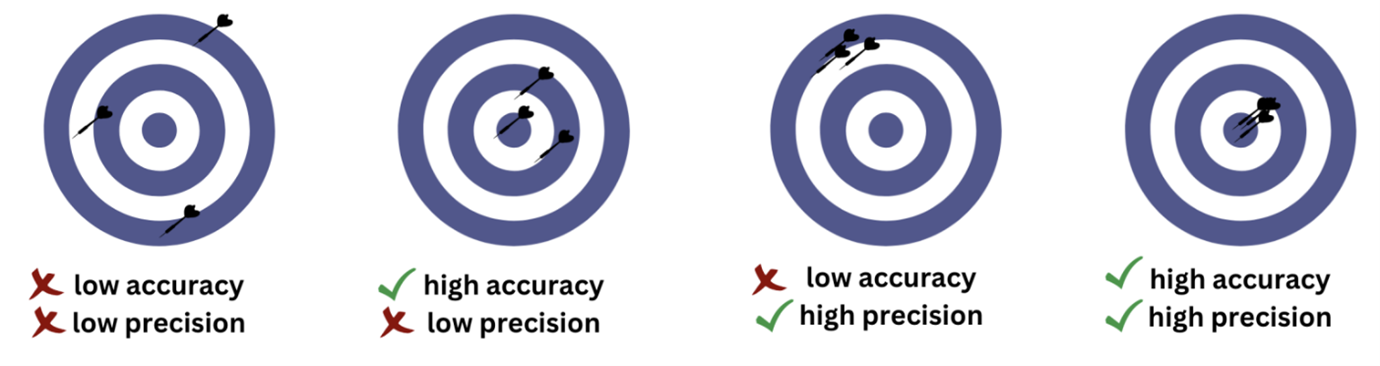
Figure 1: A visualization of precision and accuracy
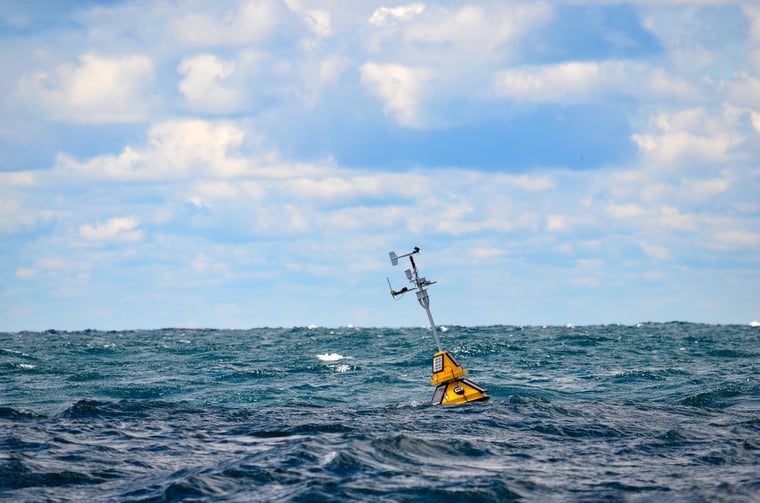
The importance of observations
To ensure the success of the forecast verification process, a consistent and complete dataset with accurate observations is essential. While observations are sometimes available through governmental and other open sources, they may not always align with the forecast locations of our customers. In many cases, we heavily depend on observations provided directly by the customer. Supplying us with accurate and reliable observations significantly enhances the accuracy of the forecast, adding substantial value to your decision-making process.Types of verification
Verification can serve various purposes and be approached in multiple ways. Verification is performed to:- Monitor forecast quality: what is the accuracy and quality over time, is there an improving or deteriorating trend?
- Improve forecast quality: can we pinpoint deficiencies and can we fix them?
- Compare forecast quality: what is the performance of different models for specific locations or during particular weather situations?
The initial form of our verification involves examining real-time observations (when available) to fine-tune the forecast for the first few hours, if needed. This adjustment occurs just before issuing the forecast to the customer, resulting in an immediate enhancement of forecast quality. Maintaining a log of the changes provides valuable insights into location-specific challenges.
A second type of verification is conducted at a later stage. We produce monthly verification reports, comparing a month of daily forecasts with a month of observational data (either provided by the customer or through open sources). Unlike the first type of verification, this method doesn't provide an immediate quality boost but rather offers an overview of forecast errors. It helps identify potential patterns, such as a consistent overestimation of wave height in a particular location or an underestimation of wind from a specific direction. This information is important for our decision-making as well, guiding us in selecting the appropriate models and fine-tuning existing ones for specific areas.
Qualitative vs. quantitative accuracy
In our monthly verification reports, we assess forecast accuracy both qualitatively and quantitatively. A first examination of forecast accuracy is presented in a simple graph (qualitative; see Figure 2). Does the forecast align well with observations? A more comprehensive analysis is conducted using various statistical methods or parameters (quantitative; see Figure 3). What are the exact forecast errors and what do they mean?
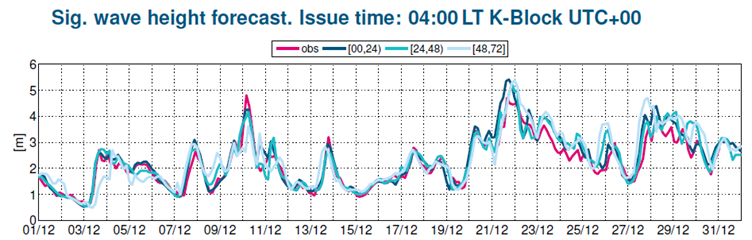
Figure 2: The graph shows forecasted significant wave height (blue) plotted against observations (pink). At first glance the forecast matches the observations quite well.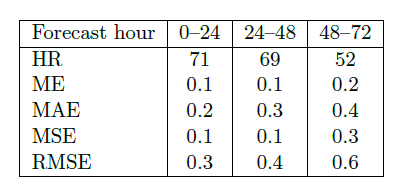 Figure 3: The table shows the statistical parameters belonging to the graph in Figure 2.
The statistical parameters that are used in our reports include (see Figure 3):
- Hit ratio (HR): this metrics shows what percentage of the forecast remains within a pre-defined threshold. The hit range lies between 0 and 100%, the perfect score is 100%.
- Mean Error (ME): this metrics is also called the bias. It show the mean systematic error. The perfect score is 0. A score below 0 means that the forecast underestimates the observations. The opposite is true for values above 0.
- Mean Absolute Error (MAE): this metrics indicates the average magnitude of the absolute forecast error; an indicator of average precision.
- Mean Square Error (MSE): this measures the average squares of the forecast errors and incorporates both the variance and bias of the forecast. It is more sensitive to outliers in the data than the MAE.
- Root Mean Square Error (RMSE): this is a frequently used measure in verification. It is a good measure of precision.
To assess whether the forecast improves as the time of interest approaches, we utilize the 00-24h, 24-48h, and 48-72h forecasts, plotting them against the corresponding observations. This approach not only helps gauge forecast accuracy over different time frames but is also useful in identifying situations with low confidence, such as when low pressure systems move over the forecast location (see Figure 4).
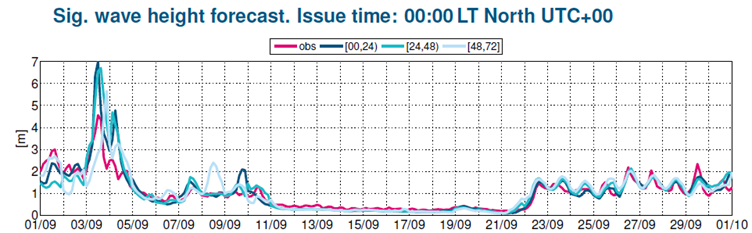
Figure 4: On the 3rd and 4th of September 2023 a low confidence situation occurred for this location just west of Taiwan. Typhoon Haikui tracked from east to west across southern Taiwan and resulted in a highly inaccurate wave height forecast.
In addition to significant wave height, as shown in Figure 2 and 4, we provide verifications for several other weather parameters, including temperature, wind speed and direction, air pressure, sea height, swell height, and wave period. The availability of these verifications depends on the observations that are accessible.
Discussing results
It is valuable for both parties, our customer and Infoplaza, to discuss the results of the verification process. For a significant project located just offshore Rhode Island, USA, we were tasked with conducting monthly forecast verifications. Based on the findings in our verification reports, we identified a tendency to overestimate waves when winds are from a westerly to southwesterly direction. This overestimation could have a substantial impact on operational considerations.
After engaging in discussions about this issue, the customer agreed to allow a slight overestimation of waves, emphasizing the importance of prioritizing safety. This serves as an excellent example of how discussing verification reports can help customers to understand the performance of our forecasts and make informed decisions regarding their operations.
How to get forecast verification
Are you interested in gaining a thorough and detailed overview of the forecast quality specifically tailored to your forecast location? Understanding the nuances of weather predictions at your location is important for making informed decisions. If you have a reliable dataset available for verification purposes, please do not hesitate to get in touch with us to discuss the possibilities.